
Automatically generate interactive process flows from process event data. It will show every event, path, and the duration based on actual execution. Full transparency to show risks or control gaps, highlight inefficiencies such as rework and bottlenecks, and track current and potential automation.
Assess process variants and standardisation across the business. See the interaction of different processes and teams. Use scenario analysis to assess the impact of data and process changes. Set variables and based on historical data calculate the impact it will have on process performance .
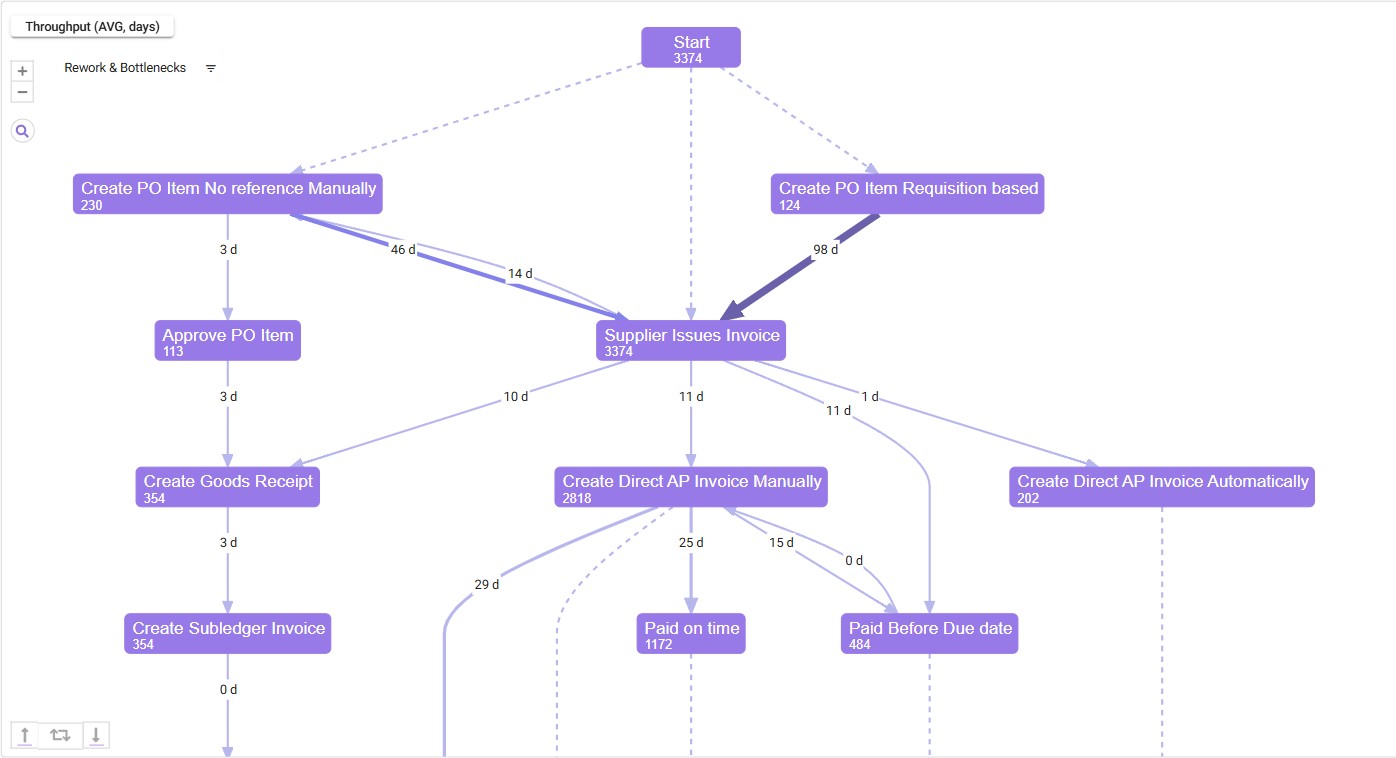


The automatically generated process flow is the core of Process Mining. It leverages the time stamps from the transactions, event, and change logs in the source systems to extract the relevant activities/events and associated links. The flow is completely interactive, and a great source to perform process-based investigation and analyses.

The dashboards provide similar graphs and visuals to most data visualisation products. There are categories or dimensions such as supplier or product and facts or measures like numbers, values, and throughput times. Clicking in a graph gives options for further filtering.

Filters in the Intellifold platform are super powerful. These can be set anywhere and apply everywhere. Filters can be applied to dimensions in the data such as company, equipment, order type etc. or can relate to process flows and KPIs. Applied filters show up at the top of the solution screen and can also be changed directly there.
Unlock real-time insights, compliance, and automation with advanced process mining and AI solutions.